
Storm Intensity Increase
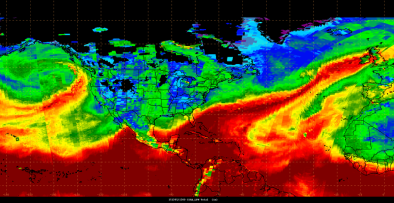
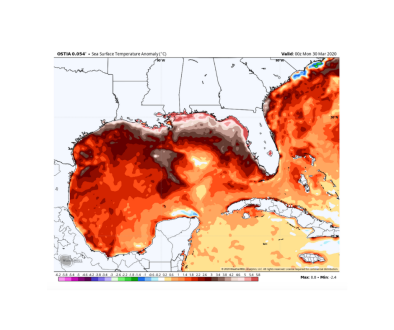
More heat and water in the atmosphere and warmer sea surface temperatures are increasing storm precipitation and could provide more fuel to increase storm wind speeds. Storm intensity is measured by the maximum surface wind speed or the minimum sea level pressure. Climate change affects many of the factors that can result in greater storm intensity. It leads to additional latent heat available in warmer air, and an increase in the meridional (or poleward) temperature gradient, which increases available potential energy.
Read More
Climate science at a glance
- Climate change is making storms wetter.[1]
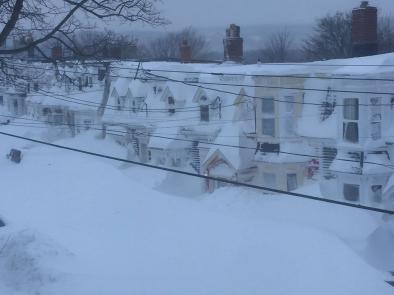
- Climate change attribution science has shown that climate change contributed to the sheer volume of moisture in the atmosphere for several storms including Hurricane Sandy, Snowmaggedon, and the Boulder floods.[2]
Background information
What are storms?
At the most basic level, a storm is any interruption of the prevailing atmospheric pressure and wind fields that causes high winds and precipitation. There are many types of storms including rainstorms, thunderstorms, snowstorms, and tropical storms. The US National Oceanic and Atmospheric Administration classifies a storm as “severe” when it produces at least one of the following: wind gusts of 58 mph or faster, hail one inch in diameter or larger, or a tornado. Storms that form in the tropics are called tropical cyclones. When a tropical storm’s maximum sustained winds reach 74 mph, it is called a hurricane. Hurricane intensity is usually measured by a storm’s wind speed. Category 5 hurricanes are the most intense and have wind speeds of 157 miles per hour or higher. Surface pressure is another indicator of hurricane intensity, and some say is a better benchmark for hurricane damage potential.[3]
US studies attribute intensifying storms to climate change
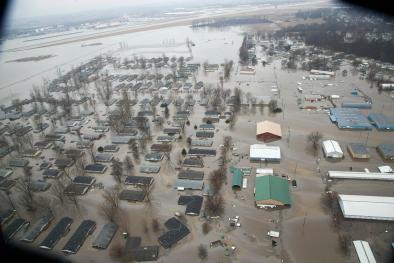
- (Pokharel et al. 2018): Intense summer storms like the 2012 derecho in Washington, DC and 2016 derecho in West Virginia have been occurring more frequently in recent decades due in part to warming of the Gulf of Mexico.[4]
- Climate change is making tropical storms and hurricanes wetter, increasing the risk of hurricane floods (Patricola and Wehner 2018). Climate change increased rainfall during Hurricanes Florence (Paerl et al. 2019), Maria (Keellings and Ayala 2019), Harvey (Trenberth et al. 2018; Wang et al. 2018), Sandy (Trenberth et al. 2015), Katrina (Trenberth et al. 2007), and during Tropical Storm Imelda (Van Oldenborgh et al. 2019).